Contents
Reports
You can build reports in APRO CRM involving the following elements:
- objects;
- activities;
- deals;
- contacts;
- calls;
- SMS.
To compile a new report, set its metrics and save them, so that your colleagues could use them as templates to build their own reports for different time periods applying various filters.
Attention: to reach report viewing and addition/edition settings for metrics, go to Main menu — Settings — CRM — Reports.
You can build reports in two formats: diagram and table.
The graphical mode implies building a diagram of function f(T), where T stands for the time along the X axis.
To set the time lapse (from the initial T up to the final T) for the diagram and its pace (dT = S (pace)), go to reports generation page: Main menu — Reports.
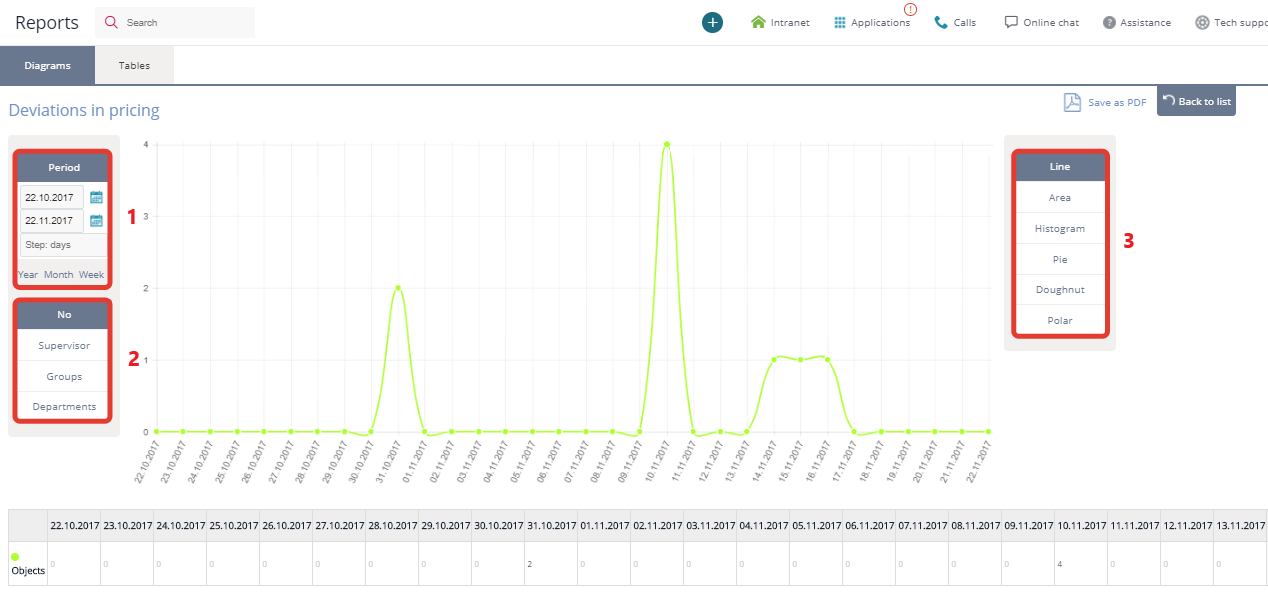
Here you can set:
1) time lapse for the diagram and its pace;
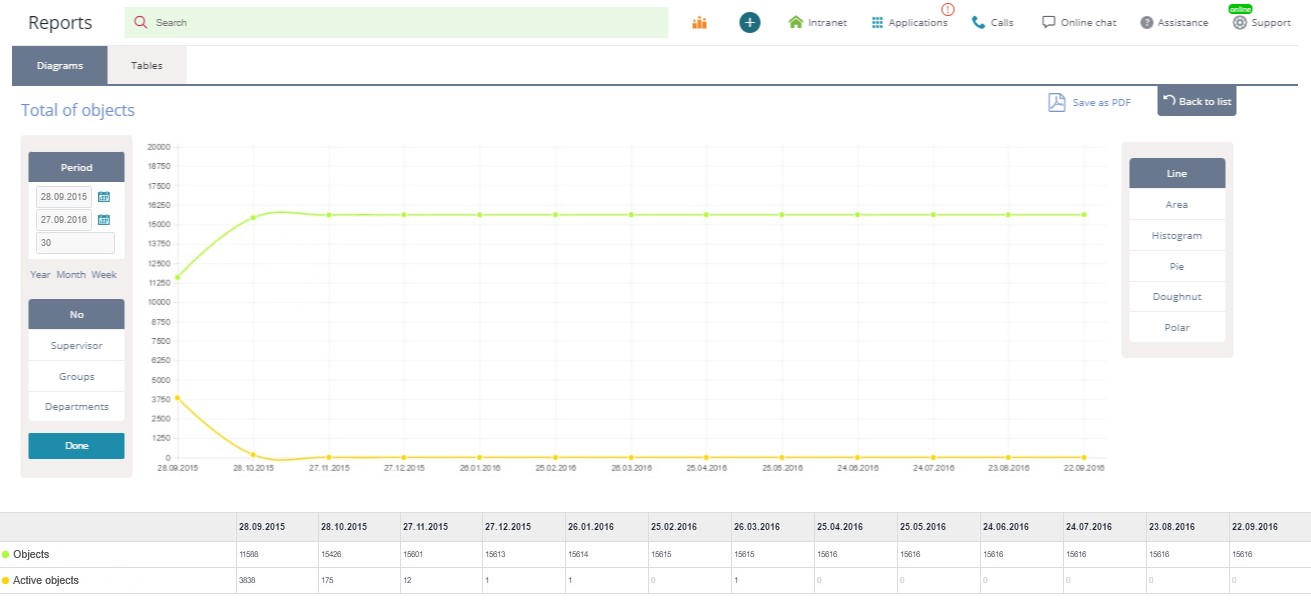
2) filter by users/groups/groups of managers/departments, and use these filters to build sample allocation (see the screenshot below);
3) type of diagram.
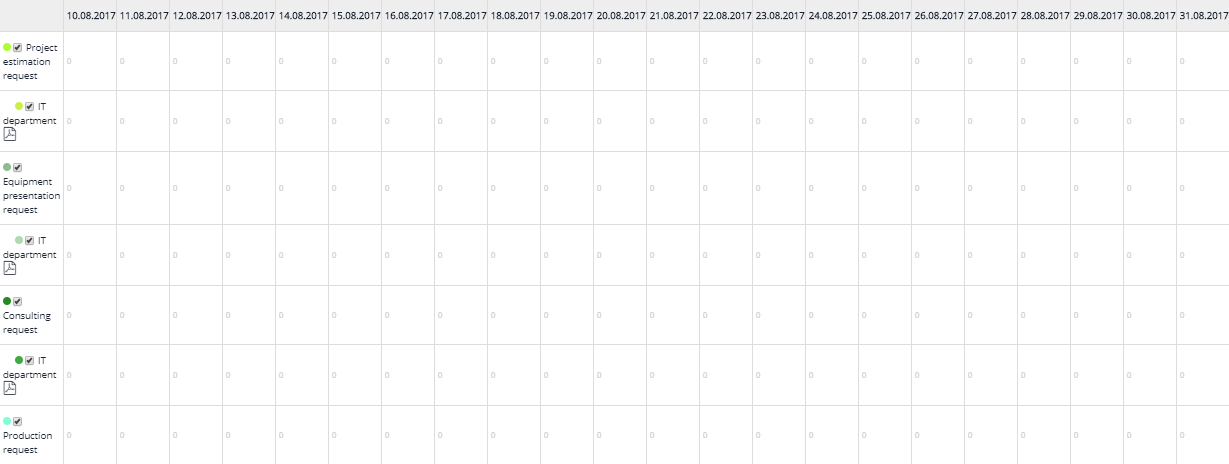
Table reports display data in an unrestricted format: each cell is filled with a calculation formula f(T1, T2), where T1 and T2 represent the values of time as function parameters.
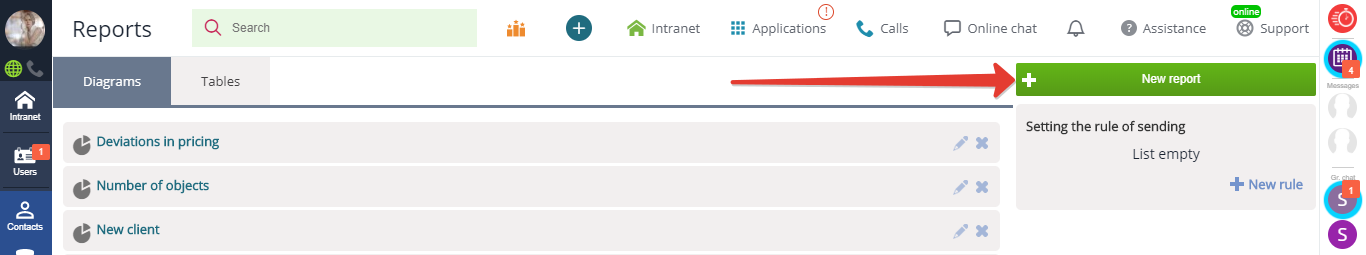
To build a report based on ready-made metrics, go to reports generation page: Main menu — Reports:
Creating metrics
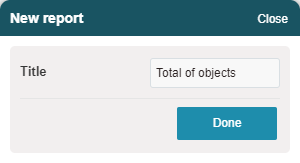
Go to Main menu — Reports and click "New report":
Enter the title of your report:
Add metrics to your diagram:
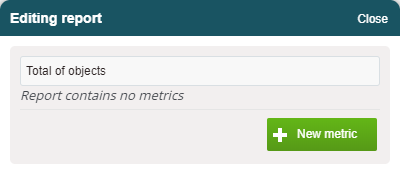
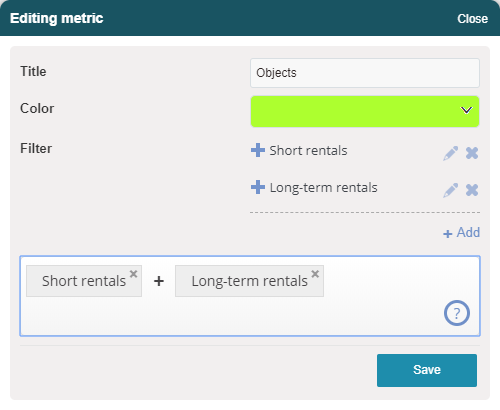
For example, let's add a report on the total number of objects, and the number of active objects.
Add a new filter to your metrics:
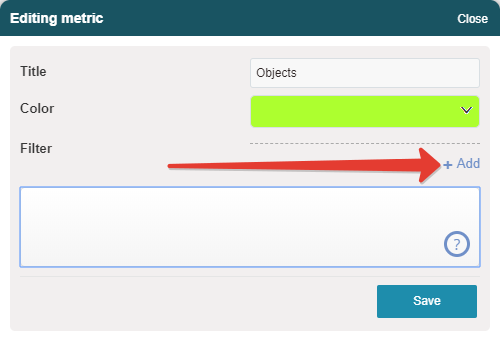
Enter the filter title and select the CRM element to apply the filter to:
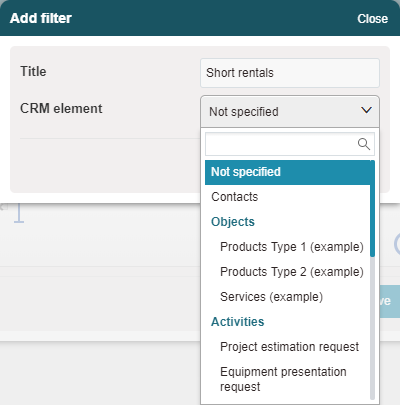
Adjust the filter parameters:
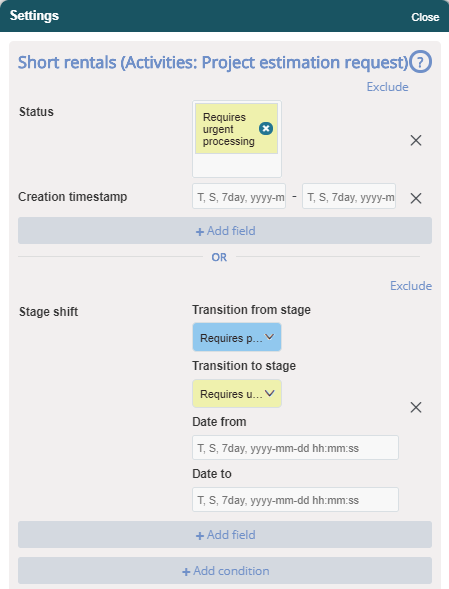
Please note: filter fields can be filled with the values of function variables, that is, time and pace.
Guide on parameters
Examples:
1. Display new objects added daily
Creation timestamp:
- value from : T
- value to : T + S
2. Display objects active daily
Creation timestamp:
- value from :
- value to : T
3. Select all entries from week ago
Creation timestamp:
- value from : T - 7day
- value to : T
If you need to display the total of objects, the filter will look as follows (all objects created before each point of time on the digram):
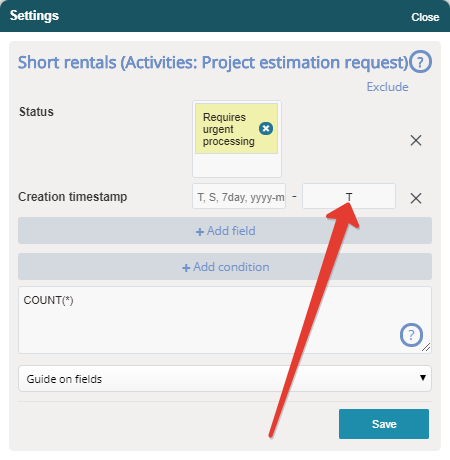
Set the parameters to be displayed: the number of elements in a selection, or a function involving the total of values of a specific field:
Guide on parameters
COUNT(*)
— total of a specific field
SUM(EXP('field_255'))
— complex expression
Compile the function form. It may comprise expressions of multiple fields with different parameters:
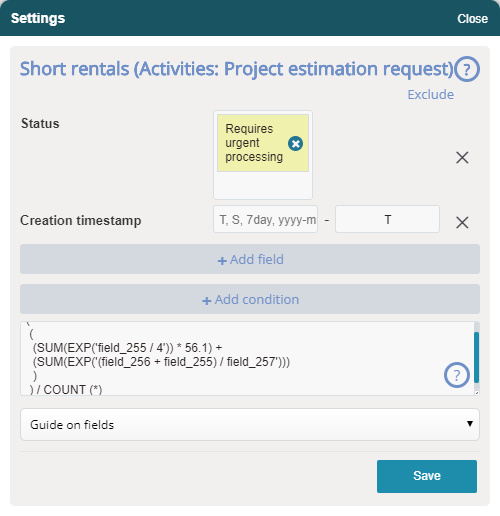
Click "Save" and compile the formula from the combination of filters:
Here is what you got:
Back to Contents